http://mindprod.com/jgloss/histogram.html
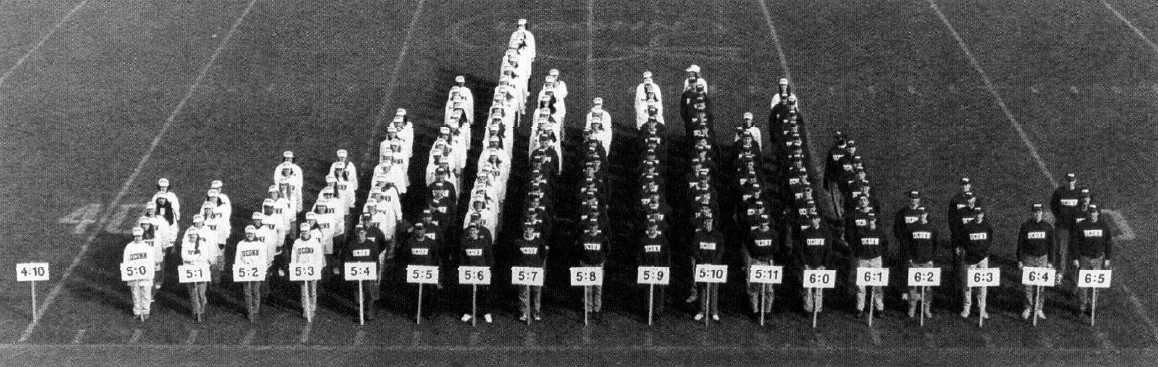
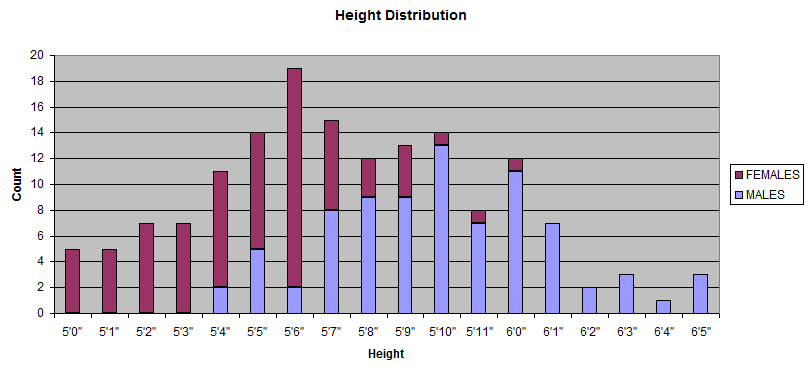
Above are two identical histograms represented first with actual people and then in a graphical representation. A histogram displays a distribution of data in a graphical form. These graphs represent height distribution among males and females ranging from 5 to 6'5'' feet. The red shows female height and the blue males in the actual graph and in the picture females simply represents females and males males.
No comments:
Post a Comment